Log Analytics
Log Management with
Context
Collect, Analyze, Visualize, and Diagnose with your Log Data along with Metrics for Complete Visibility at Scale
Unified Log Management and Full-stack Monitoring
Motadata Log Analytics is intended to assist organizations in gathering, analyzing, monitoring, and visualizing log data for rapid investigation, troubleshooting, and higher-level analytics. Effortless Collection Methods Combine Logs, Metrics, and Streaming Data for a Centralized View with Deeper Context for Analyzing Logs Events.
Actionable Insights for Services, Apps, Systems, Devices
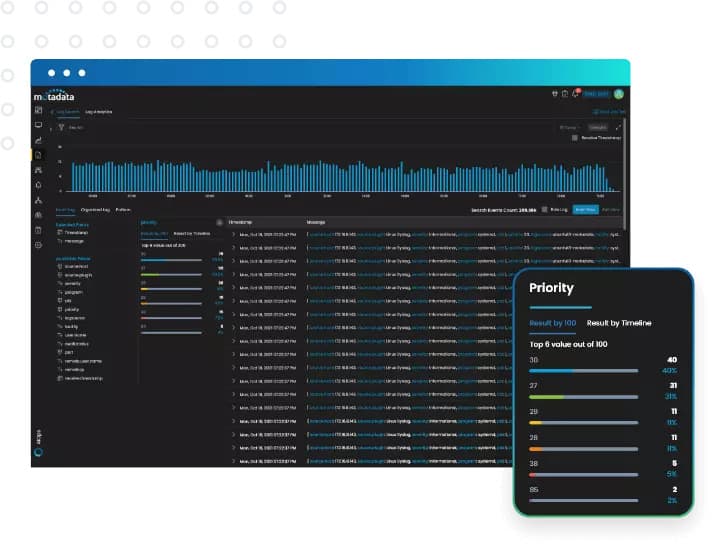
As logs are forwarded, Motadata immediately clusters the received log data in real-time and intelligently surfaces trends in log activity.
- Collect and Correlate: Collect logs from a heterogeneous environment with agent-based or agent-less collection methods. Correlate your logs and metrics via email, Slack, and other channels.
- One-Stop Solution: One robust agent that collects any type of data or format from any kind of source. One-stop solution to install, configure, and scale.
- On-demand Customization: Stay in Compliance with log retention, audit, or regulation for legacy log reporting policies based on your organization’s requirements.
AI-Based Log Analytics
Make machine learning and advanced analytics level up your investigation and troubleshooting. Monitor and manage your logs data with a Log management solution that is easy to deploy and effortless to manage.
- Centralized Configuration: Log pattern analytics for rapid insight across millions of log events. Store and connect your logs data in a centralized location to detect anomalies and respond to them more quickly.
- Reduced MTTR: Use log clustering to consolidate your operational visibility for all your applications and services. Reduce MTTR by troubleshooting with 100+ out-of-box Log Parsing apps, which groups surrounding logs to search in seconds.
- Advanced Analytics: Monitor, analyze, and diagnose hybrid and multi-cloud environment issues with a unified platform — get advanced analytics in real-time driven by machine learning.
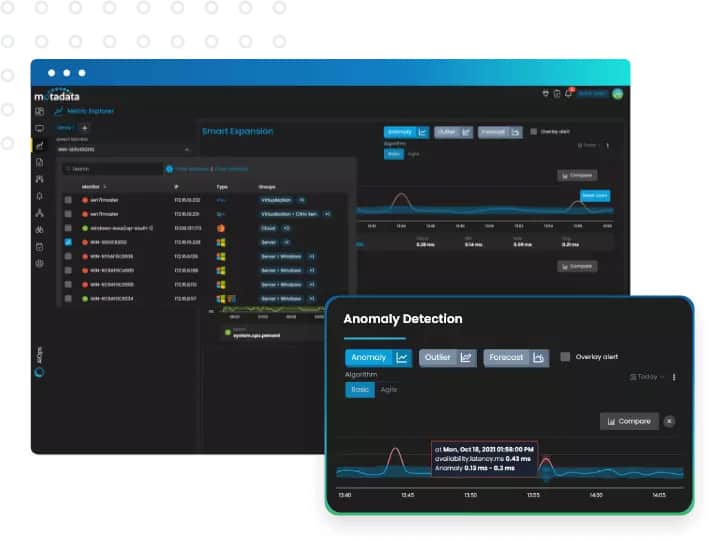
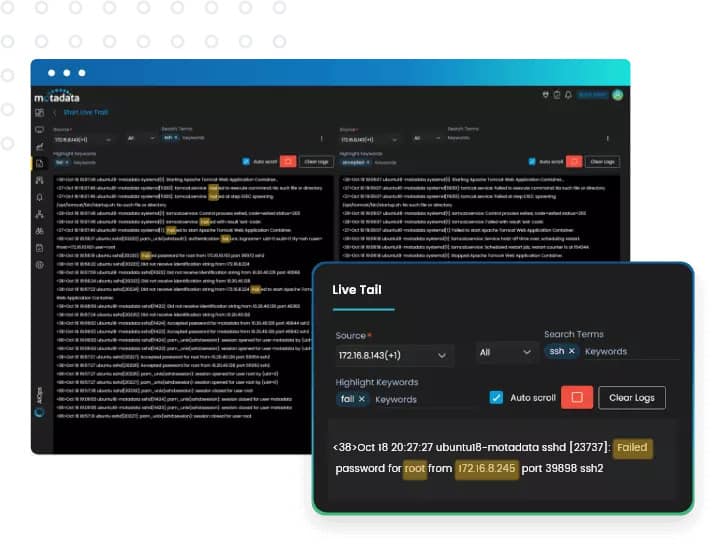
Live Tail and Alerting
- Smart Alerting: Use anomaly detection to automatically identify abnormal behavior. Get the alerts you want to be notified about and receive them via email, Slack, and other channels.
- Live Log Tail: Put live tail in action to see the live feed logs data from multiple sources. Intelligently analyze and aggregate log events across apps, devices, and systems.
Unlocking Powerful Insights with Log Monitoring Tool
Our exceptional Log Monitoring tool provides unparalleled visibility into the health and performance of your applications, databases, servers, networks, and more. By leveraging the wealth of information stored within these logs, you gain a deeper understanding of your systems, enabling you to maintain the data records in a synchronized way.
Logs act as a digital security camera, recording every action within your system. This allows you to detect suspicious activity, identify potential security breaches, and take swift action to mitigate threats. The software also provides insights into system resource utilization, application behavior, and network traffic patterns. By analyzing these trends, you can identify areas for improvement and optimize your infrastructure for peak performance


Out-of-the-Box Log Management
Massive volumes of log data produced by modern infrastructure are difficult to store and process. Effective log management also requires having all log data accessible in one place.
Motadata Log Management tool dynamically parses and visualizes millions of lines of log data. Machine learning-powered pattern matching lets you quickly identify relevant logs and observe their live trails in real-time.
Log monitoring alerts are the most effective way to safeguard your infrastructure’s integrity and security. At Motadata, we recognize how important preventive measures are for maintaining operational efficiency.
Our sophisticated log monitoring system ensures that you can quickly identify any security risks and keep an eye on critical infrastructure events. You can handle problems before they become worse through real-time notifications, ensuring the dependability and security of your systems.
Key Features of Motadata Log Management Tool Motadata’s comprehensive event log analyzer provides the following procedural features:
Collect
With Motadata, you can easily collect data from every part of your infrastructure. Never miss a beat with our flexible agent-based or agent-less solution, and easily interface with a variety of sources, including operating systems, applications, and networking devices.
Parse
Using Motadata’s parsing capabilities, raw logs can be quickly transformed into useful insights. Take advantage of pre-built log parsers, dynamic parsing features, and custom log parser plugin support for languages like Python and Go to get useful data adapted to your requirements.
Analyze
With Motadata’s advanced analytical tools, uncover significant trends and insights within your data. Robust log search features like live log tailing and pattern detection enable you to track performance, find problems quickly, and make educated choices.
Visualize
Use Motadata’s user-friendly visualization tools to see how your infrastructure is performing. Look at pre-made dashboards that are specific to your technology or build your own dashboards and widgets. Simple querying makes it easy to go through your data and quickly get useful insights.
Inclusive Log Management Solutions for Your Technology Stack
Given the complexity of modern IT settings, Motadata has built its platform to support a broad range of technologies. Whatever your operating system—Windows, Linux, or numerous cloud platforms—our solution provides extensive log management features suited to your particular configuration. We ensure that you don’t overlook any data source, including databases, network devices, and application logs, providing a comprehensive view of your entire infrastructure.
You can quickly collect, manage, analyze, and showcase logs from across your technological stack, which helps you get useful insights and make informed decisions. Our scalable and versatile solution helps you efficiently monitor and optimize your IT operations, regardless of your size.
Contact Us
Drop us a line
Have a question about our intelligent solutions? Drop an email below, a RAS Infotech representative will contact you shortly.